Margin Research’s Social Cyber project was originally hosted on a graph database (DB) technology called DGraph. In an unfortunate turn of events, DGraph ceased to exist as a company, requiring the Margin Research team to migrate our analysis tool to a different graph DB: Neo4J. This brought the question to mind: Would our analysis tool have been able to detect or predict the collapse of DGraph? The answer is yes. Detailed below are the results of our analysis.
To conduct a post-mortem on DGraph we measured how active the project was over the course of its lifespan. The project began in 2014 and ran through 2022. We used three measures for activity:
- Number of Active Github Repos contributed to (how big is the project growing)
- Number of Git Commits to these repos (how often were changes being made)
- Number of unique contributors to the project (how many people were contributing)
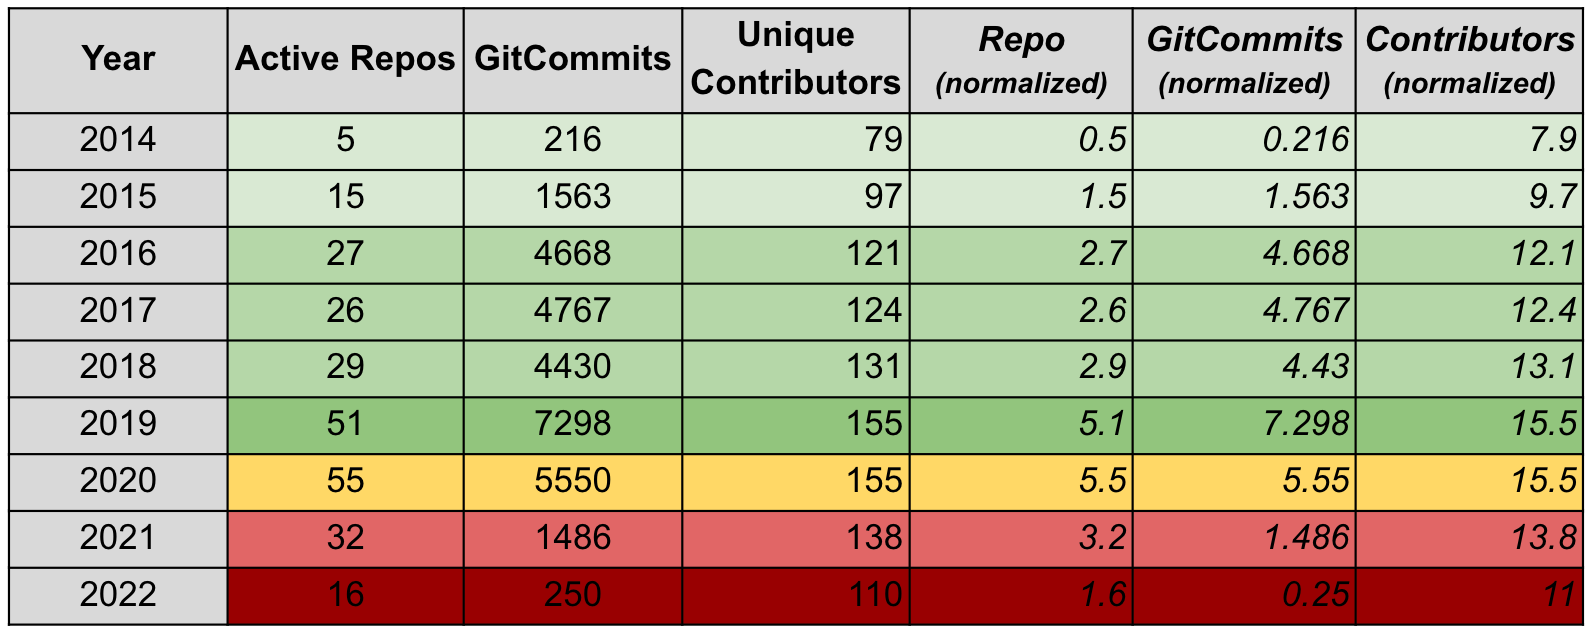
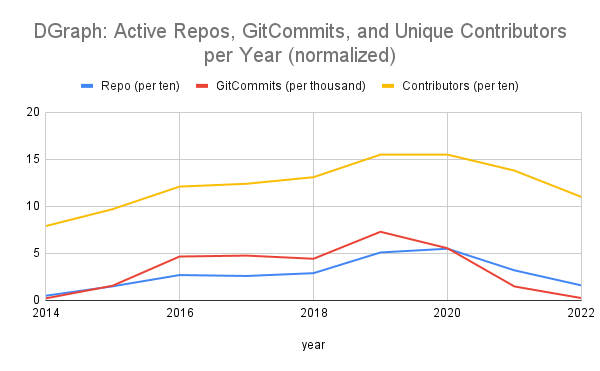
Below in Table 1 are the raw data collected to answer this question, followed by Chart 1, which visually depicts the normalized data set. Table 1 has highlighted in yellow a drop in yearly Git commits. Highlighted in light red is the year that we see DGraph begin to really struggle.


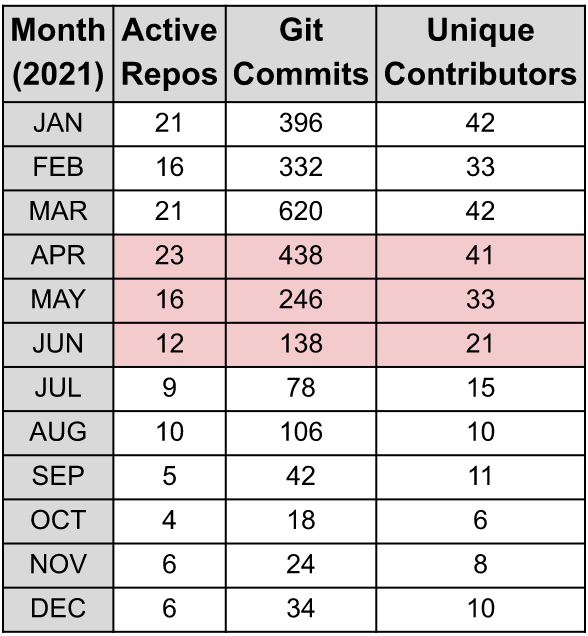
We can see that activity peaks in 2019, and then precipitously falls off at the beginning of 2020. The change in Git commits from 2019 (7298) to 2021 (1486) is a major indicator on the condition of the project. From this graph we can determine that the health of DGraph wanes from 2020 onwards. We can then drill down deeper using a month-by-month analysis to continue to try and figure out exactly when things went wrong. Below we have a breakdown of 2021 in the same layout as above:


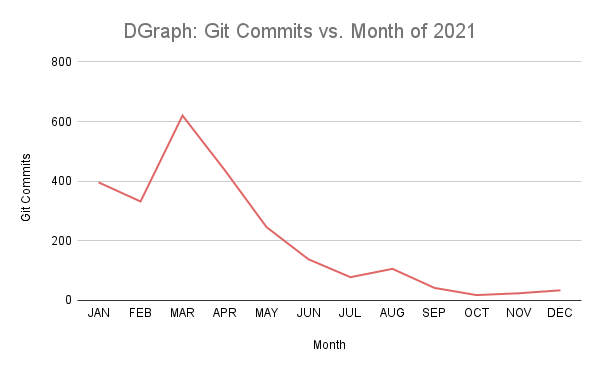
Here it becomes even more clear where exactly the project dies. The months of April, May, and June show three consecutive reductions in commits to the project. Git commits then bottom out. Had we not already known that DGraph failed, this indicator would have been the evidence our team would need to confirm that the company was in dire straits and unlikely to persist. Sure enough, at the start of 2022 Manish Jain, the CEO of DGraph, published on the company website:
[In] June 2021, in a rug pull event, we were told by the board to shut down the company. To avoid that, we did layoffs to conserve cash, prove revenue and raise from external investors. But, our raise was tainted by the events from June, and we couldn’t.”
Our analysis clearly depicts the rumors of funding issues in April/May, the board’s order to shut the company down in June, and the failure of the company throughout the remaining months of 2021. This analysis can be applied to any project publicly hosted, gives clear and reproducible indicators for company health, and requires little in terms of graph computational power.
This is a clear example of the utility of analyzing the social networks that power open-source projects, rather than the open-source code itself. Millions of Open Source projects are hosted on the web, and Margin Research’s Social Cyber tool allows us to peek behind the curtain of a projects outward facing marketing, code-health scores, and branding in order to extract information about the true health of an open-source ecosystem.
